
 )
or https:// means you’ve safely connected to
the .gov website. Share sensitive information only on official,
secure websites.
)
or https:// means you’ve safely connected to
the .gov website. Share sensitive information only on official,
secure websites.

Census tracts are those delineated in the 2020 Census, as described in 83 FR 56277. The shapefiles used to characterize census tract and therefore place mines within them are 2020 TIGER/Line Geodatabases as defined by the U.S. Census Bureau.
A coal mine is identified for purposes of the energy community credit bonus if it is or has been in the Department of Labor’s Mine Safety and Health Administration’s (MSHA’s) “Mines” data set after Dec. 31, 1999. Mines for the energy community credit bonus are those with a type of “Surface” or “Underground.”
A mine will be identified as “closed” if after Dec. 31, 1999 it has ever been listed in MSHA’s Mines dataset as having a status of “Abandoned” or “Abandoned and Sealed.” The definition of “mine status” can be found on pages 3-4 of the Instructions for Completing the Mine Information Form (MSHA 2000-209). The map showing the census tracts that have had coal mine closures since 1999 and census tracts directly adjoining to such census tracts is based on MSHA’s Mines dataset as of May 1, 2023. Historical versions of MSHA’s Mines dataset are also used to identify mines that have ever had, since Dec. 31, 1999, a status of “Abandoned” or “Abandoned and Sealed.”
An electric generating unit is identified according to its presence in the Department of Energy’s (DOE’s) U.S. Energy Information Administration (EIA) Electric Generator Inventory data from Form EIA-860, supplemented with Monthly Electric Generator Inventory from EIA-860M.
Data from forms EIA-860 and EIA-860M provide listings of retirements. An electric generating unit is considered a retired coal-fired electric generating unit if it is classified as retired at any time since December 31, 2009, and at the time of being listed as retired is characterized as a coal-fired electric generating unit. The map showing the census tracts that have had coal-fired electric generating unit retirements since 2009 and census tracts directly adjoining to such census tracts is based on EIA-860 and EIA-860M data available as of May 1, 2023.
An electric generating unit is characterized as “coal-fired” based on the available data for past years. For years 2014 to 2023, coal-fired electric generating units are those listed in EIA Form 860M or EIA Form 860 data as having a “Technology” of “Conventional Steam Coal” or “Coal Integrated Gasification Combined Cycle.” For years 2010 to 2013, coal-fired electric generating units are those listed in EIA Form 860 data as having a primary fuel source code of anthracite coal, bituminous coal, lignite coal, refined coal, coal-derived synthesis gas, subbituminous coal, and waste/other coal.
No. An electric generating unit must be coal-fired when it is retired to be considered a retired coal-fired electric generating unit. An electric generating unit is a retired coal-fired electric generating unit if it (1) appears in the retirements listing of any monthly release of the dataset from Form-860M since December 31, 2009, or any annual release of the dataset from Form-860 since December 31, 2009, (2) the month and year of retirement occur after December 31, 2009, and (3) for years 2014 through the most recent monthly listing, it is listed as having a “Technology” of “Conventional Steam Coal” or “Coal Integrated Gasification Combined Cycle” in the retirement listing, or for years 2010 through 2013, it is listed as having a primary fuel of one of the following in the retirement listing: anthracite coal, bituminous coal, lignite coal, coal-derived synthesis gas, subbituminous coal, waste/other coal (including anthracite culm, bituminous gob, fine coal, lignite waste, and waste coal), or refined coal.
Access coal mine data through the Department of Labor’s Mine Safety and Health Administration (MSHA) “Mines” data set.
For validation purposes, review the following:
- Does the mine appear in the Mines dataset?
ο If not, contact MSHA at mshadata@dol.gov.
ο If yes, next check the location information.
- Do the latitude and longitude listed place the mine in the county and state listed?
- Do the latitude and longitude listed extend beyond the tenth decimal place (for example, format XXX.XXXXXX)?
- If the answer to either of these is no, then contact MSHA at mshadata@dol.gov.
- What information should I provide to MSHA when I contact the Agency?
ο Name and contact information of the person or entity submitting the recommended change
ο Mine ID (if known)
ο Operating Company Name (if known)
ο Mine Name (if known)
ο County and state where the mine is or was located
ο Street address of the mine (if known)
ο Current latitude and longitude of mine in the Mine Data Retrieval System (MDRS) (if known)
ο Recommended latitude and longitude of mine (make certain there are 6 digits to the right of the decimal point) - If MSHA considers the suggested correction valid, then the Agency will update the Mines dataset accordingly.
- See below for timing of updates to the IRS census tract listing and the DOE map based on any data corrections from MSHA.
First, check to see if there is an issue with the location data for the coal-fired generating electric unit:
- Coal-fired electric generating unit data comes from the Department of Energy’s (DOE’s) U.S. Energy Information Administration (EIA) Electric Generator Inventory data from Form EIA-860, and the Monthly Electric Generator Inventory from EIA-860M.
- Does the coal-fired electric generating unit appear in the EIA Form 860 or EIA Form 860M data?
ο If not, contact EIA via InfoElectric@eia.gov.
ο If yes, next check the location information.
- Do the latitude and longitude listed map the mine to the county and state listed?
- Do the latitude and longitude listed extend beyond the tenth decimal place?
- If the answer to either of these is no, then contact EIA via InfoElectric@eia.gov.
- What information should I provide to EIA when I contact them?
ο Name and contact information of the person or entity submitting the recommended change
ο Plant ID and Generator ID (if known)
ο Operating Company Name (if known)
ο Plant Name (if known)
ο County and state where the unit is located
ο Street address of the unit (if known)
ο Current latitude and longitude of unit in the EIA Form 860 or EIA Form 860M data (if known)
ο Recommended latitude and longitude of unit (make sure there are at least 4 digits to the right of the decimal point) - If EIA considers the correction valid, then it will update the EIA Form 860 and/or EIA Form 860M data accordingly.
- See below for timing of updates to the IRS census tract listing and the DOE map based on any corrected data from EIA.
Census tracts shapefiles from the U.S. Census Bureau are used to identify adjoining census tracts. Census tracts are considered directly adjoining if their boundaries touch at any single point. There are many cases where multiple census tracts meet at a single point. If a closure occurred in one of the census tracts, the other census tracts sharing the single point would be considered directly adjoining.
Figure 1 shows an example of census tracts with their 6-digit identifiers. All of these census tracts are considered directly adjoining to census tract 009102.
Fig. 1: Example of adjoining census tracts
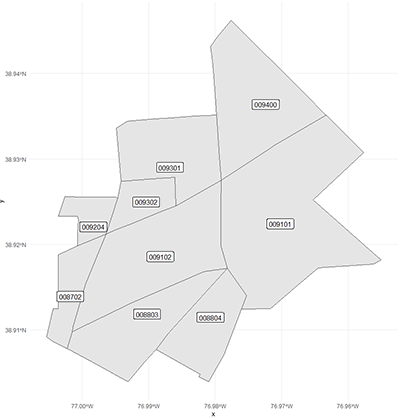
Source: Treasury Office of Tax Analysis.
Census tract boundaries may follow rivers or other waterways. However, these waterways do not prevent census tracts from being directly adjoining. Census tract boundaries may incorporate waterways by either extending into waterways or by wholly covering a waterway within a census tract.
Figure 2 shows one example of how a waterway may interact with census tracts. This shows census tract 007100 (denoted without the floating zeroes as “71”) having a border in the river. Census tract 007601 (denoted here as 76.01) also has a border in the river. Census tracts 007100 and 007601 are directly adjoining to each other. Additionally, Census tracts 006804 (denoted 68.04) and 007601 are also directly adjoining to each other.
Fig. 2: Waterways in census tracts
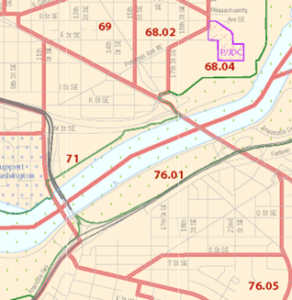
Source: https://www.census.gov/geographies/reference-maps/2020/geo/2020pl-maps/2020-census-tract.html
MSAs are groups of counties or county-equivalents. They are grouped according to standards determined by the Office of Management and Budget (OMB). These standards are updated every 10 years in accordance with the decennial census of the United States. For this initial release of MSAs that may qualify as energy communities, Treasury/IRS will use the MSA delineations provided by OMB in its April 18, 2018 bulletin (Bulletin No. 18-03). These delineations reflect the OMB Standards for Delineating Core Based Statistical Areas published in 75 FR 37245 for the 2010 Decennial Census. These delineations cover the United States, the District of Columbia, and Puerto Rico. The OMB Bulletin No. 18-03 delineations were chosen, rather than a later update, to be consistent with the delineations of non-MSAs described below.
To determine boundaries of non-MSAs, Treasury/IRS primarily follow the May 2021 Metropolitan and Nonmetropolitan Area Definitions (May 2021 OEWS Metropolitan and Nonmetropolitan Area Definitions (bls.gov)) published by the Occupational Employment and Wages Statistics division of the Bureau of Labor Statistics (BLS). The BLS works in conjunction with individual states and Puerto Rico to determine nonmetropolitan area definitions. MSAs are first delineated, and then counties outside of MSAs are grouped together as nonmetropolitan areas.1
For each of the Island Territories of American Samoa, Guam, the Commonwealth of the Northern Mariana Islands, and the U.S. Virgin Islands, the whole territory is grouped as one non-MSA.
See IRS Notice 2023-29, Appendix A, for a full listing of MSAs and non-MSAs defined for the purposes of the energy community bonus.
1Treasury/IRS non-MSA delineations differ from the BLS provided definitions in the New England states by strictly following county boundaries for MSA and non-MSA boundaries. For MSAs, these boundaries directly follow OMB Bulletin No. 18-03. The non-MSAs in these New England states delineated in IRS Notice 2023-29 include the counties in a BLS defined nonmetropolitan area that have no portion in an MSA.
Direct employment related to the extraction, processing, transport, or storage of coal, oil, or natural gas, termed fossil fuel employment (FFE), is estimated using employment in the following industries, according to their 2017 North American Industry Classification System (NAICS) codes:
NAICS codes included in fossil fuel employment
NAICS code | Description |
211 | Oil and Gas Extraction |
2121 | Coal Mining |
213111 | Drilling Oil and Gas Wells |
213112 | Support Activities for Oil and Gas Operations |
213113 | Support Activities for Coal Mining |
32411 | Petroleum Refineries |
4861 | Pipeline Transportation of Crude Oil |
4862 | Pipeline Transportation of Natural Gas |
The FFE rate is determined as the number of people employed in the above NAICS codes as listed in the County Files of the County Business Patterns (CBP) published annually by the Census Bureau, divided by the total number of people employed in that area. CBP data include information on Puerto Rico and the other U.S. territories in the County Equivalents for Puerto Rico and Island Areas File. The FFE and total employment for each county in the MSA/non-MSA is aggregated to determine whether the MSA/non-MSA meets the FFE threshold of 0.17 percent.
Treasury/IRS calculates the FFE rate for each year the CBP dataset is available beginning with data for 2010. If a MSA or non-MSA meets the 0.17 percent threshold in 2010 or later years, it retains this status.
For IRS Notice 2023-29, Appendix B, and the latest available CBP data is for calendar year 2020 (released in April 2022). For IRS Notice 2023-47 Appendix 1 and Appendix 2, the latest available CBP data is calendar year 2021 (released in April 2023). When looking at past years, the groupings of counties into MSAs and non-MSAs are held fixed to those described in Appendix A of IRS Notice 2023-29. For example, suppose counties P, Q, and R are listed in Appendix A as comprising MSA Z. Therefore, when calculating the FFE rate for MSA Z for each year from 2010 to 2020, it is always considered to be comprised of Counties P, Q, and R.
The 2017 NAICS codes used to describe direct employment related to the extraction, processing, transport, or storage of coal, oil, or natural gas are the same as the 2012 and 2007 NAICS codes. As such, any of the 2007, 2012, or 2017 NAICS codes listings could have been used for these specific NAICS codes.
For the 2010-2017 CBP data, the Census Bureau provided a range of employment values when the point value of the cell was not provided out of confidentiality or data quality concerns. A cell in this case is the employment level for a county and industry sector pairing. Treasury used a value for the suppressed cell within the range of values provided in the CBP documentation. Generally, this value was chosen to be the midpoint between the lower bound and the midpoint of the lower and upper bounds of employment values for a cell for which a point value is not available. The midpoint between the lower and upper bounds was not used because that generally led to aggregated industry employment in the county file to be above the employment reported for those same industries in the national CBP file.
An adjustment for the total level of employment for the county is only made when the total employment level provided in the CBP data (as indicated by a null NAICS code) was suppressed for a particular county and a range of values was provided. The same adjustment procedure of using the midpoint between the lower bound and the midpoint of the lower and upper bound was used for these cases as well.
No. The MSAs and non-MSAs currently shaded blue on the map have only met the FFE threshold of 0.17 percent. The MSAs and non-MSAs currently shaded purple on the map have met both the FFE threshold of 0.17 percent and the higher-than-the-national-average unemployment rate threshold. See the answers to FAQ #19 and FAQ #22 for further detail regarding the determination of the unemployment rate threshold.
MSAs and non-MSAs that have met the FFE threshold for any year since 2009 and have an employment rate at or above the national average unemployment rate for the previous year qualify as energy communities under the IRA.
The unemployment rate for MSAs/non-MSAs and the nation is determined using the calendar year Local Area Unemployment Statistics (LAUS) for counties (Tables and Maps: U.S. Bureau of Labor Statistics (bls.gov)). The county tables report the total number of individuals in the labor force and the total number unemployed. These amounts are then summed for each county within an MSA/non-MSA to determine the total labor force and number of unemployed individuals. The unemployment rate is calculated by dividing the number of unemployed individuals within the MSA/non-MSA by the total labor force. The unemployment rate for each MSA/non-MSA that met the FFE threshold is then compared to the national unemployment rate as calculated from the same file. Those MSAs/non-MSAs that met the FFE threshold and have an unemployment rate for the previous year that is greater than the national average are listed as energy communities.
Annual unemployment rates for the prior year are generally released in April of the next calendar year. When the unemployment rates are released for future years, Treasury/IRS will then update the listing of MSA/non-MSAs that have passed both the 0.17 percent FFE threshold and the higher-than-the-national-average unemployment rate threshold.
The 0.17% direct employment threshold for metropolitan statistical areas (MSAs) and non-metropolitan statistical areas (non-MSAs) is set by statute. See, e.g., section 45(b)(11)(B)(ii) of the Internal Revenue Code.
The MSAs and non-MSAs listed in Appendix B to Notice 2023-29 have met the 0.17% or greater direct fossil fuel employment requirement in one or more years after 2009. MSAs and non-MSAs that meet this criterion will remain on this list. New MSAs and non-MSAs that meet this criterion in later years will be added to this list, for example, see Appendix 1 to Notice 2023-47. To qualify as an energy community, the MSAs and non-MSAs listed in Appendix B to Notice 2023-29 and Appendix 1 to Notice 2023-47 must also have an unemployment rate that is at or above the national average unemployment rate for the previous year (see FAQ #23 for more information).
MSAs and non-MSAs must meet two thresholds to qualify as energy communities starting on January 1, 2023. The MSAs and non-MSAs must have had (1) for at least one year after 2009, 0.17% or greater direct employment related to extraction, processing, transport, or storage of coal, oil, or natural gas (the fossil fuel employment (FFE) threshold), and (2) an unemployment rate for 2022 that is equal to or greater than the national average unemployment rate for 2022. These MSAs and non-MSAs that meet the 2022 unemployment rate requirement are energy communities as of January 1, 2023, and will maintain that status until the unemployment rates for 2023 become available and a new list of MSAs and non-MSAs that qualify as energy communities is provided. The guidance that determines the MSAs and non-MSAs that are energy communities based on 2023 unemployment rates will likely be released in May 2024.
New annual unemployment rates are released in approximately May of each year. Therefore, the listing of MSAs and non-MSAs that qualify as energy communities will be updated each year. Generally, an MSA’s or non-MSA’s energy community status in future years will last from May of the initial year through April of the following year.
Yes. An MSA or non-MSA that has had 0.17 percent or greater direct employment at any time after December 31, 2009, or 25 percent or greater local tax revenues related to the extraction, processing, transport, or storage of coal, oil, or natural gas may qualify as an energy community if its unemployment rate for the previous year is at or above the national average. Because an MSA’s or non-MSA’s status as an energy community depends on its unemployment rate for the previous year, an MSA or non-MSA that qualifies as an energy community in one period might not qualify as an energy community in a later period if its unemployment rate for the previous year falls below the national average. The list of MSAs and non-MSAs that qualify as an energy community for the period beginning on January 1, 2023, may be found at Notice 2023-47 Appendix 2.
The map and community listings will be updated with the following timing:
In approximately May of each subsequent year until the energy community bonus credit expires:
- The map will be updated according to any new MSAs/non-MSAs that have achieved the 0.17 percent or greater direct employment related to the extraction, processing, transport, or storage of coal, oil, or natural gas.
- The map will be updated according to the updated annual unemployment rates for MSAs and non-MSAs.
- The map will reflect the census tracts and directly adjoining census tracts of any newly identified closed coal mines and/or retired coal-fired electric generating units.
The shapefiles for the data layers can be found on the EDX resource page here: https://edx.netl.doe.gov/dataset/ira-energy-community-data-layers.
For purposes of the energy community bonus credit, a brownfield site is defined in 42 U.S.C. § 9601(39)(A) as real property, the expansion, redevelopment, or reuse of which may be complicated by the presence or potential presence of a hazardous substance, pollutant, or contaminant (as defined under 42 U.S.C. § 9601), and includes certain mine-scarred land (as defined in 42 U.S.C. § 9601(39)(D)(ii)(III)). A brownfield site does not include the categories of property described in 42 U.S.C. § 9601(39)(B).
For purposes of the energy community bonus credit, including the brownfield site safe harbor described in section 5 of IRS Notice 2023-29, a brownfield site is delineated according to the boundaries of the entire parcel of real property, the expansion, redevelopment, or reuse of which may be complicated by the presence or potential presence of a hazardous substance, pollutant, or contaminant. A brownfield site is not limited to only the portion of a parcel of real property that has or may have a hazardous substance, pollutant, or contaminant that complicates redevelopment.
The main difference between the definition of a brownfield site for purposes of the energy community bonus credit and for determining eligibility for federal Brownfield funding is that the energy community bonus credit applies a more limited definition.
For purposes of the energy community bonus credit, a brownfield site is limited to sites that are described in 42 U.S.C. 9601(39)(A), (B), and (D)(ii)(III), which is a subset of the sites that may qualify for federal Brownfield funding. Section 9601(39)(C) and (D) of Title 42 of the United States Code includes categories of sites that are eligible for federal Brownfield funding but do not meet the definition of a brownfield site for purposes of the energy community bonus credit. Please see Brownfields | US EPA and https://www.epa.gov/sites/default/files/2018-10/documents/web-content-info-on-site-eligibility.pdf for more information.
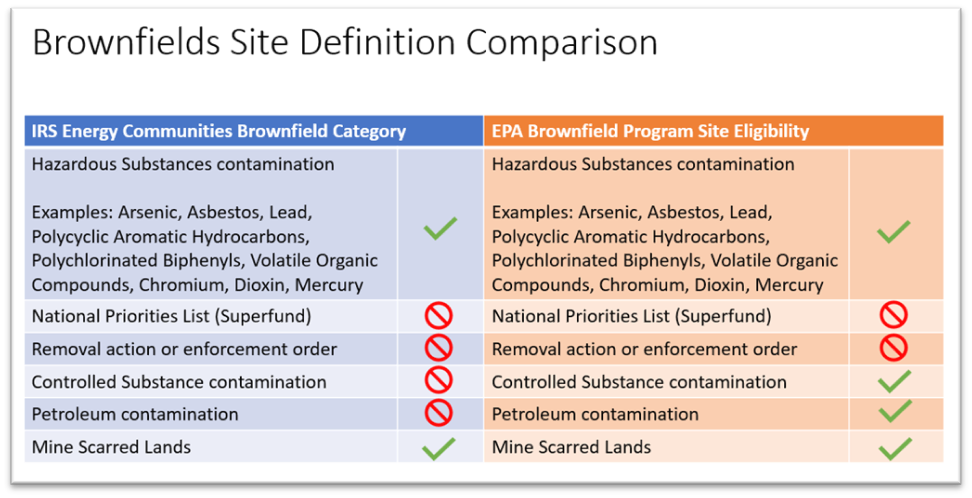
No, the brownfield definition for purposes of the energy community bonus credit does not include sites with only petroleum contamination.
There is not a single registry, website, or map of all brownfield sites. Potential site lists may be found under the category of Brownfields Properties on the EPA’s Cleanups in My Community webpage, which lists the locations of sites assessed with federal Brownfield funding. Similar webpages may be maintained by states, territories, or for federally recognized Indian tribes. However, not all properties that qualify as brownfield sites eligible for federal Brownfield funding are included in the definition of brownfield site for purposes of the energy community bonus credit.
No, a comprehensive map of sites that meet the definition of a brownfield for purposes of the energy community bonus credit is not available.
EPA’s Brownfields Program provides direct funding for brownfields site assessment, cleanup, revolving loans, environmental job training, technical assistance, training, and research. Additional information is available online at the EPA Brownfield website: https://www.epa.gov/brownfields/types-epa-brownfield-grant-funding
Brownfield site stakeholders may contact EPA regional Brownfield representatives who are available to assist with cleanup and redevelopment efforts at brownfield sites. These representatives serve as a valuable resource for Brownfield stakeholders by providing support and guidance on applicable laws, regulations, and policies, and technical assistance associated with the selection of technologies. An EPA contact list is available online: https://www.epa.gov/brownfields/brownfields-contacts-epa-regional-offices
EPA’s RE-Powering America's Land Initiative (“RE-Powering”) provides information about existing renewable energy projects, future site locations, and state-based programs to encourage renewable energy projects on landfills, brownfields, mines, and other contaminated lands. For more information available online about state programs, program impacts, steps to select and design successful programs, and program implementation tips, please visit:
- Link to EPA RE-Powering website: https://www.epa.gov/re-powering
- Subscribe to the RE-Powering listserv: https://www.epa.gov/re-powering/subscribe-re-powering-listserv
The Department of Energy’s Office of Clean Energy Demonstration (OCED) program on Current and Former Mine Land is designed to demonstrate the technical and economic viability of carrying out clean energy projects on current and former mine land. OCED offers no-cost technical assistance to inform decision making on topics related to developing clean energy projects on mine land. Technical assistance will vary based on specific project needs/requests and intends to support any phase of project development, including concept development, planning, design, or execution. For more information, you can request assistance at https://www.nrel.gov/state-local-tribal/ceml-technical-assistance.html
The brownfield site safe harbor provided in section 5 of IRS Notice 2023-29 offers taxpayers certainty in determining whether a site meets the definition of a brownfield site for purposes of the energy community bonus credit. Under this safe harbor, the IRS will accept that a site meets the definition of a brownfield site under 42 U.S.C. § 9601(39)(A) if it satisfies at least one of the conditions described in section 5.02 of IRS Notice 2023-29 (see FAQ #42 for more detail) and the site is not described in 42 U.S.C. § 9601(39)(B).
A site qualifies for the brownfield site safe harbor if it meets any one of the following three conditions and it is not described in one of the exclusions provided in 42 U.S.C. § 9601(39)(B):
(1) The site was previously assessed through federal, state, territory, or federally recognized Indian tribal brownfield resources as meeting the definition of a brownfield site under 42 U.S.C. § 9601(39)(A);
(2) A Phase II Assessment has been completed with respect to the site and such Phase II Assessment confirms the presence on the site of a hazardous substance as defined under 42 U.S.C. § 9601(14), or a pollutant or contaminant as defined under 42 U.S.C. § 9601(33); or
(3) For projects with a nameplate capacity of not greater than 5MW (AC), a Phase I Assessment has been completed with respect to the site and such Phase I Assessment identifies the presence or potential presence on the site of a hazardous substance, or a pollutant or contaminant.
A site qualifies for this safe harbor provision if a federal, state, territory, or federally recognized Indian tribal program that supports the evaluation of potential contamination at sites by collecting and reviewing existing information has determined that the site qualifies as a brownfield site under the definition in 42 U.S.C. § 9601(39)(A) and is not excluded under 42 U.S.C. § 9601(39)(B).
A12. No. For purposes of the Energy Community Bonus Credit, a Brownfield site does not include the categories of property described in 42 U.S.C. § 9601(39)(B), the first of which excludes a facility that is the subject of a planned or ongoing removal action under 42 U.S.C. subchapter I. When the site is no longer subject to the Superfund removal action, the property may be considered a Brownfield site, provided that it meets all of the other requirements for a Brownfield site under § 45(b)(11)(B)(i).
No. For purposes of the Energy Community Bonus Credit, a Brownfield site does not include the categories of property described in 42 U.S.C. § 9601(39)(B), the second of which excludes a facility that is listed on the National Priorities List (Superfund) or is proposed for listing. If the property is delisted from the National Priorities List, it is no longer subject to this exclusion and may be considered a Brownfield site, provided that it meets all of the other requirements for a Brownfield site under § 45(b)(11)(B)(i).
Generally no; a landfill subject to such closure requirements generally would be considered a “land disposal unit” excluded from the definition of a Brownfield site under 42 U.S.C. § 9601(39)(B)(vi).
Generally no; a landfill that is undertaking an RCRA Corrective Action cleanup generally would be excluded from the definition of a Brownfield site under 42 U.S.C. § 9601(39)(B)(v).
Yes. Mine-scarred land may qualify as a Brownfield site for purposes of the Energy Community Bonus Credit. In order to qualify, such land must be real property, the expansion, redevelopment, or reuse of which may be complicated by the presence or potential presence of a hazardous substance, pollutant, or contaminant. 42 U.S.C. § 9601(39)(A). However, mine-scarred land that falls under any of the exceptions found in 42 U.S.C. § 9601(39)(B) does not qualify as a Brownfield site for purposes of the Energy Community Bonus Credit, even if it otherwise meets the definition in 42 U.S.C. § 9601(39)(A).